Keep Informed on Progress Being Made!
Visual Dashboards
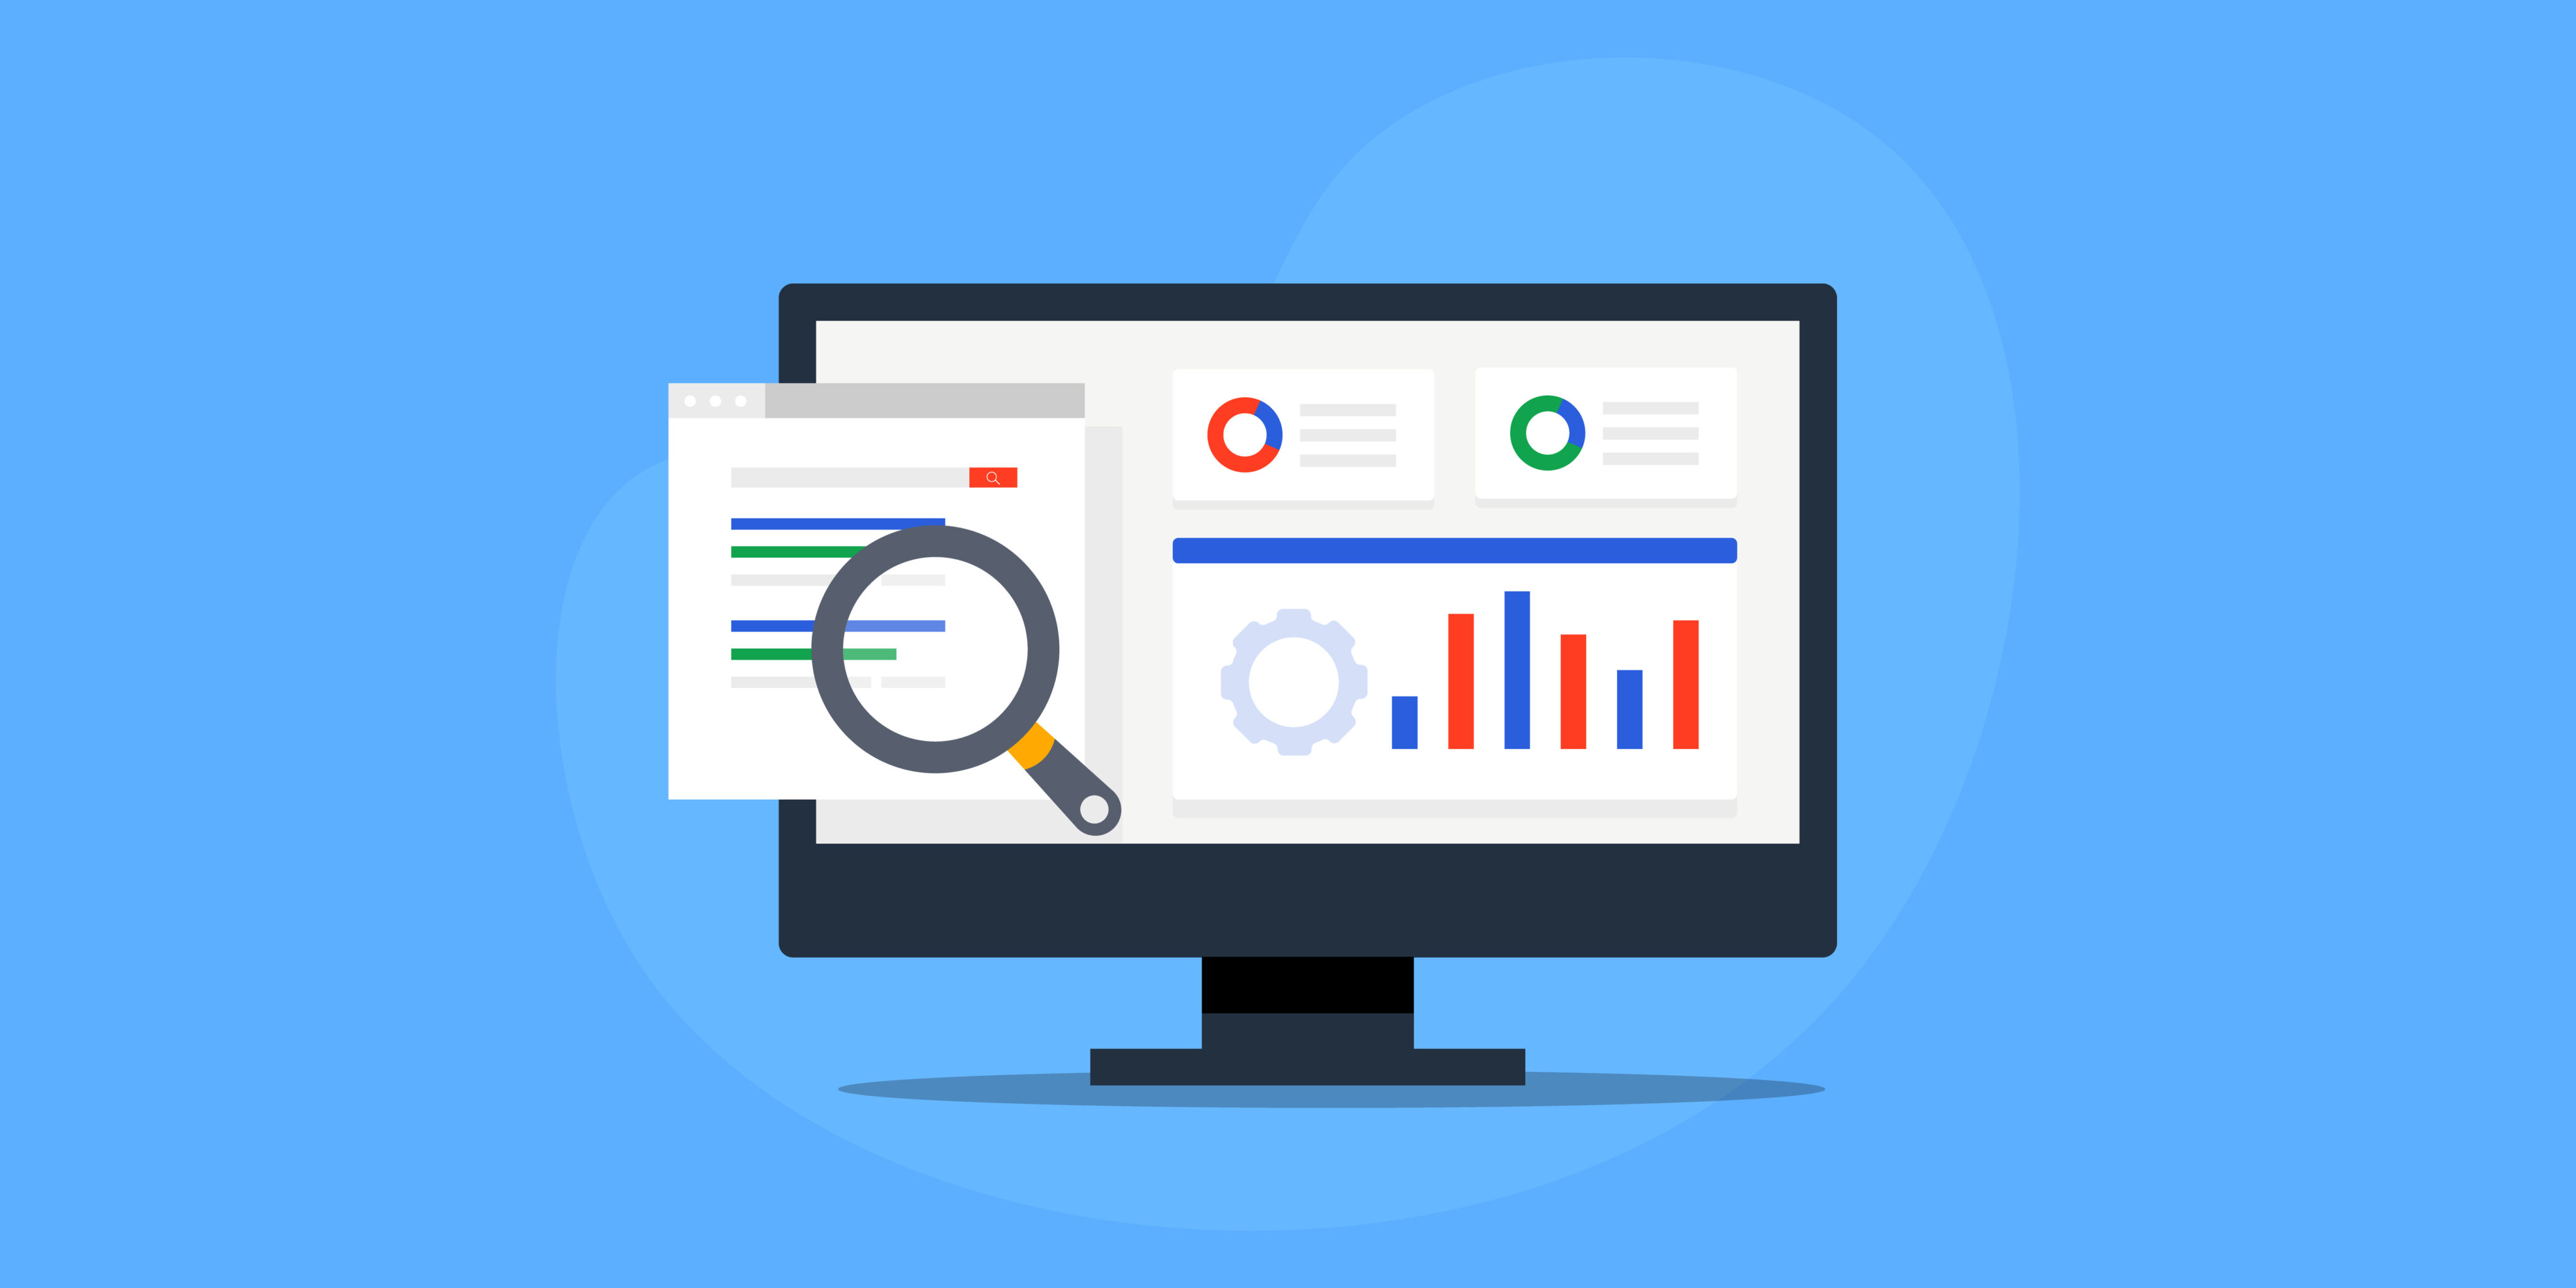
The following links provide visual performance dashboards. These are supporting aides to help communicate City performance to the public.

Department Objective Progress
A look at how Departments are working to achieve these strategic priorities. This outlines annual objectives set by departments and their current progress in achieving them.

Strategic Performance Dashboard
Performance Data Dashboard (highlights KPIs for Departments).

Capital Project Dashboard
Capital Projects progress and udpates.

Community Insights
Census and geographical data dashboards.
Helpful Definitions
VISUALIZATIONS
THE PROCESS OF TAKING RAW DATA AND TRANSFORMING IT INTO CHART, GRAPHS, OR OTHER VISUAL DISPLAYS THAT HELP Identify TRENDS OR PATTERNS.
GIS/MAPPING
GEOGRAPHIC INFORMATION SYSTEM, THAT CAPTURES AND DISPLAYS GEOGRAPHICALLY REFERENCE DATA.
DASHBOARDS
THE USE OF DATA VISUALIZATIONS TO PROVIDE A HIGH-LEVEL OVERVIEW BY CONSOLIDATING VARIOUS SOURCES INTO AN INTERACTIVE SCREEN.
KPI & Objectives
Key Performance Indicators (KPI) provide you quantifiable information that helps a Department understand where they currently are. Measurable Objectives help establish what they want to achieve and if they are achieving them and how they are getting there.

